Pour manger mieux !
Chaque semaine, Foodies tente de répondre aux questions que tout le monde se pose sur ce qu'il y a dans nos assiettes. Suivez nous !
LIRE PLUS17 September 2021
While strong efforts have been made over the years towards self-sufficiency, Mauritius currently imports around 75% of its food requirements.
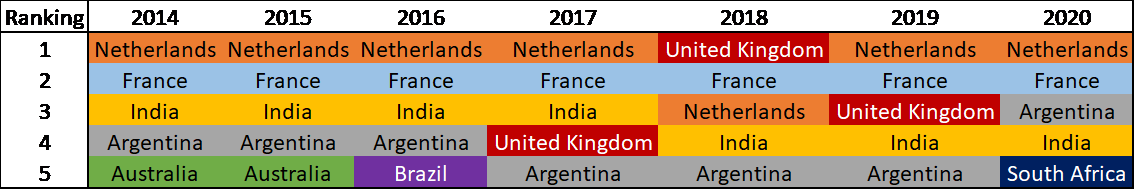
The total volume of food items imported per year amounted roughly to 900,000 tons in 2019 compared to 760,000 tons in 2010, with little change to the mix of the countries of origin :
The current pandemic has shed some light on the financial cost of freight but what about the ecological impact ?
How can we calculate that ?
The estimate is based on a number of assumptions:
While all of these assumptions can be discussed, they are useful for a first approximation.
The estimates are based on the method devised by the Professor Alan McKinnon. The basic formula is:
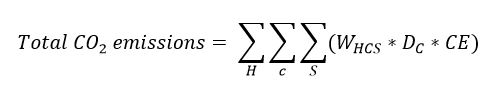
Where
C is the country of origin
S is the shipment number
H is the HS Code
W is the weight of container
D is nautical distance between Mauritius and the country of origin
The carbon footprint per TEU for average deep sea container vessels = 8.4 g CO2 per tonne-km
1 Nautical mile = 1.852 km
Results
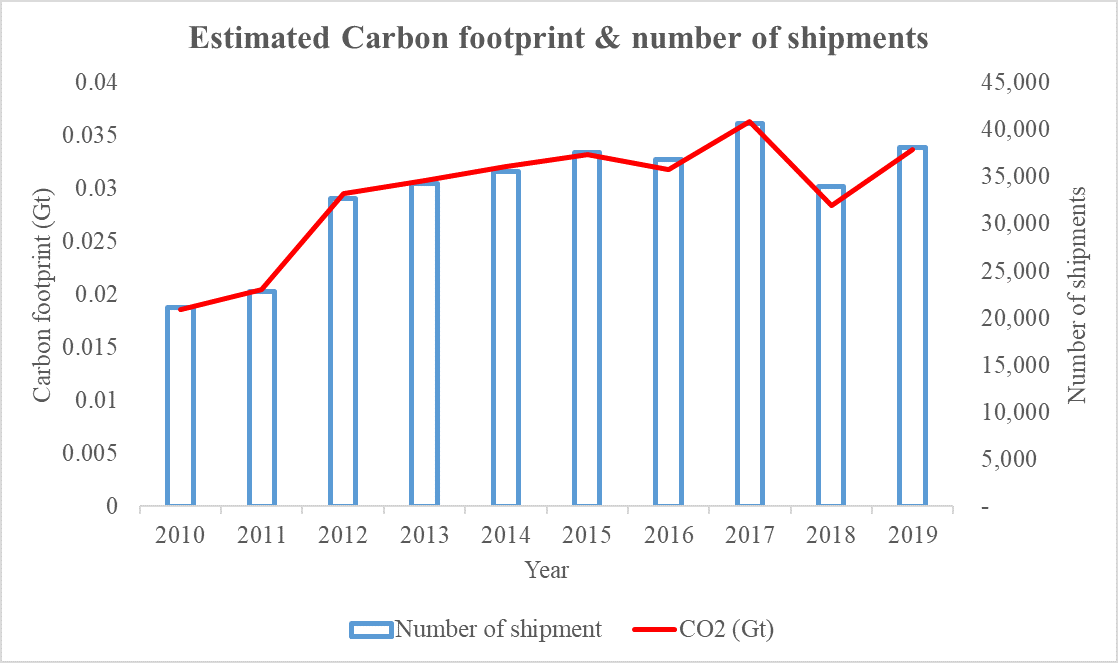
The estimated carbon footprint of importing food items to Mauritius was 0.0337Gt in 2019 compared to 0.0185 Gt in 2010.
Comparatively global shipping emits 0.94 Gt per year, i.e. our imports seem equivalent to 3.6 % of the global shipping emissions.
The estimated number of container shipments was 38,000 in 2019 compared to 21,000 in 2010. The total number of containers (food & non-food) coming to Mauritius represent less than 0.35% of global container movements but our carbon footprint accounts more much more than 3%.
So what do we make of that ?
Mauritius cannot live in isolation but has sought to become more self-reliant over the past few years. At times, the desire to support local products has conflicted with notions of competitivity.
As countries strive to factor in ecology in the value ascribed to goods and services, understanding the carbon footprint of imports brings an important perspective to these discussions.
12 May 2026
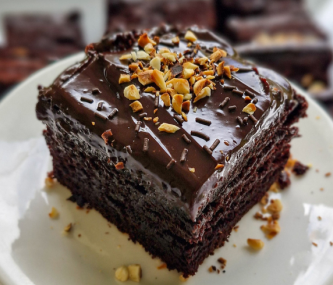
Attention les gourmands ! Rien de mieux qu’un moelleux au chocolat.
12 May 2026
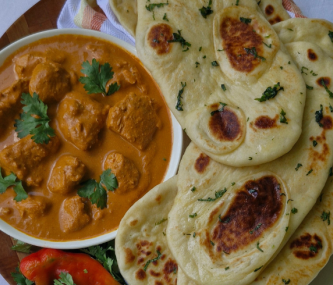
Imazinn sa! Enn Naan so-so tramp sa dan enn bon Butter Chicken ek so lasos.
12 May 2026
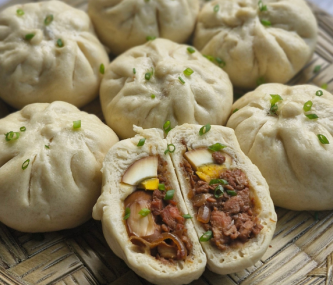
Enn bon Pao fondan ek bien farsi.